
Preventive vs predictive maintenance in industrial plants: which one to use
Preventive maintenance is done on a fixed time or run-hour schedule. Predictive maintenance is done when measurements show a fault developing. The U.S. Department of Energy puts average savings at 12 to 18% for preventive over reactive and 8 to 12% for predictive over preventive (PNNL). Most plants use both, matched to how each asset fails.
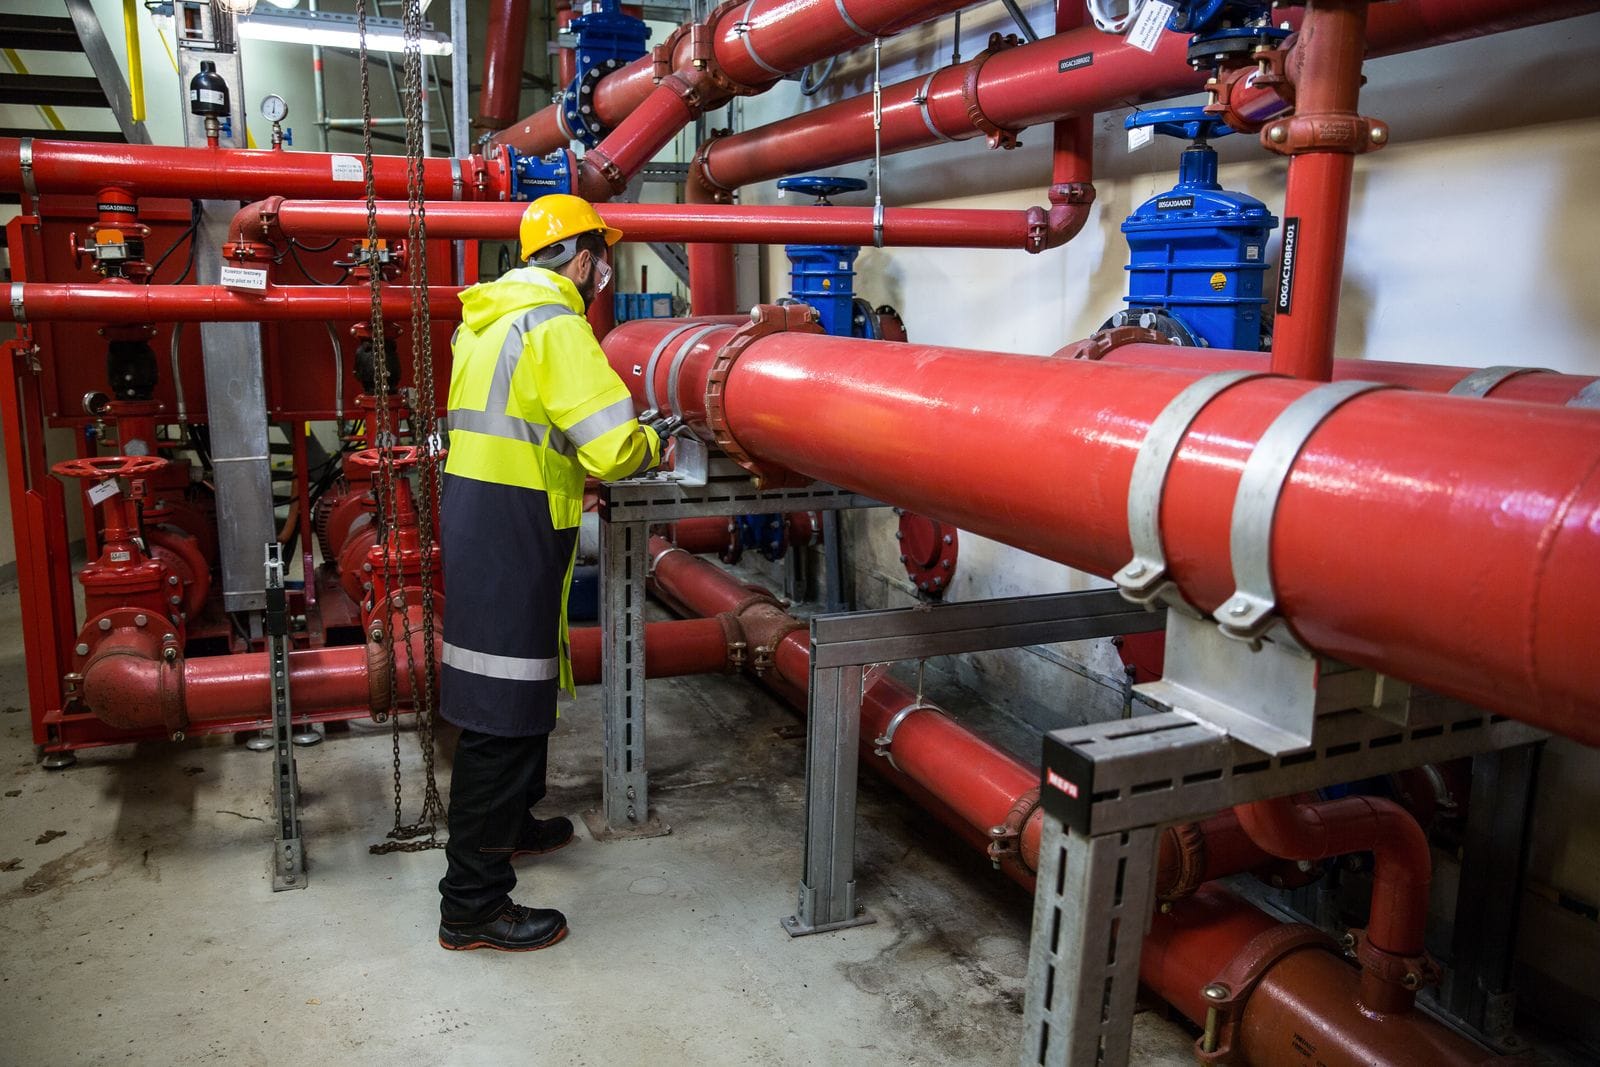
Every plant already does some maintenance. The question is when. Do you wait for the machine to stop, service it on a calendar, or watch it and act when it starts to slip? Those are the three approaches, and the choice between preventive and predictive is where most of the money and most of the arguments sit. This guide explains the difference, what each approach saves according to published sources, and how to pick per asset. It follows on from our guide to rotating equipment failures, which covers the faults predictive tools look for.
Our plant maintenance service supports both approaches. Nothing here is a sales pitch for one over the other, because the honest answer is a mix.
What’s the difference between preventive and predictive maintenance?
Preventive maintenance is action on a time-based or machine-run-based schedule to detect, prevent or reduce degradation and extend a component’s life. Predictive maintenance is measurement that detects the onset of degradation, so the cause can be dealt with before significant deterioration (PNNL). Reactive maintenance, the third approach, means running it until it breaks and restoring it afterwards.
| Approach | Trigger | Typical tools | Strength | Weakness |
|---|---|---|---|---|
| Reactive | Failure | None | No planning cost | Unplanned downtime, secondary damage |
| Preventive | Calendar or run hours | Checklists, lubrication rounds, scheduled overhauls | Simple to plan and audit | Some tasks are done too early or aren’t needed |
| Predictive | Measured condition | Vibration, oil analysis, thermography, ultrasound | Acts only when needed | Needs data, skills and good alarm settings |
Reliability-centered maintenance is described as a strategic combination of all three (PNNL). That’s the direction most plants end up in.
What does each approach save?
The U.S. Department of Energy’s O&M guidance gives average savings of 12 to 18% for preventive over reactive maintenance and 8 to 12% for predictive over a preventive program (PNNL). Predictive is put at 30 to 40% over reactive (Reliable Magazine). These are averages across many facilities, not a promise for yours.
Read the baseline before you read the number. A savings figure measured against reactive maintenance always looks bigger than the same figure measured against preventive (Reliable Magazine). If you already run a decent preventive program, the realistic upside of going predictive is the smaller 8 to 12%. Reliable Magazine rates some famous, much larger claims as low confidence, and we leave them out.
When does predictive maintenance not pay?
It doesn’t pay when the alarms are wrong. Every false alarm costs a truck roll, a teardown or a needless part swap, and noisy models add cost instead of removing it (Reliable Magazine). In one McKinsey analysis from 2021, a 10% false-positive rate erased the savings on a program.
That’s the practical catch. Predictive maintenance is not a sensor purchase. It’s a sensor, a baseline, an alarm setting, someone who understands the reading and a workflow that acts on it. Skip any of the five and the equipment is monitored but not managed.
How do you choose per asset?
Choose per asset, using how it fails. If you can measure a fault developing, monitor condition. If wear follows time or hours, a fixed interval works. If failure is cheap and safe, running to failure can be the right call. If none of that is true, the fix is design: redundancy, a better component or a change in duty.
Criticality comes first. A pump with no spare that feeds a process line deserves condition monitoring. A small fan on a redundant pair may be fine on a lubrication round. Rank your assets by the consequence of failure before you spend on either approach.
What is a sensible mix?
The DOE guidance offers a benchmark target mix for O&M programs of about 20 to 30% reactive, 25 to 35% preventive and 30 to 40% predictive. It also notes that every program has its own optimal mix (PNNL). Treat it as a reference point, not a target to hit.
A small plant with few critical machines may sit well below the predictive share. A large refinery with many critical rotating assets may sit above it. What matters is that the mix is chosen deliberately, asset by asset, and reviewed after each failure.
What changes on a Caribbean plant?
Crews are smaller and specialists are further away, which shapes what is practical. That’s our reading, not a sourced statistic. Route-based vibration readings, oil sampling and thermography can be done by a trained technician with a portable instrument, and the analysis can be done remotely. Time-based tasks still matter for coatings, lubrication and inspections in salt air, as in our corrosion inspection checklist and the schedules in API 653 inspection intervals.
Spare parts lead times push the same way. If a critical bearing takes weeks to arrive, the value of an early warning is higher, because it turns a breakdown into a planned job. Planned shutdowns are the natural place to do the work, as we outline in our turnaround planning checklist.
How do you start?
Start small and prove it on a few assets before expanding. A program that grows from working examples survives. One that starts with hundreds of sensors and no owner usually doesn’t.
List safety, environmental and production impact for each machine.
Rotating equipment with vibration, oil or heat signatures is the usual start.
Take readings when the machine is healthy. Set limits that avoid constant false alarms.
One named person reads the trend on a fixed day and decides.
If false alarms climb, tune the limits before adding sensors.
Lubrication, coating and inspection rounds continue alongside the monitoring.
- Preventive is calendar-based. Predictive is condition-based. Most plants need both.
- DOE averages: 12 to 18% savings for preventive over reactive, 8 to 12% for predictive over preventive.
- Always check the baseline. A figure against reactive looks bigger than against preventive.
- Predictive fails when alarms are wrong or nobody owns the reading.
- Choose per asset by consequence of failure and by how it fails.
- Start with three to five critical assets and prove the value.
Frequently asked questions
Need help planning plant maintenance?
Tasweldermechanics supports plant maintenance and equipment repair across the Caribbean, mobilized from Sint Maarten. Tell us what you run.
Request a quoteView plant maintenance EN
EN ES
ES